$999,000 This new renovated home features a bright open kitchen with brand-new stainless appliances, sunken living room, enclosed sunroom. The main level offers three bedrooms and... Sutton Group West Coast Realty
| |||||||||||||||||||||
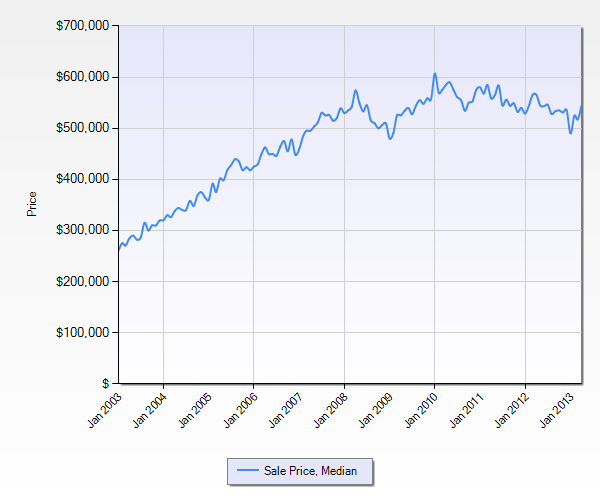
维多利亚地区独立屋价格走势
(下图显示时间从 2003年1月到 2013年4月)

维多利亚地区房地产市场报告
2013年01月
|
|
2013年1月 - January |
2012年12月 - December |
2012年1月 - January |
||||||
|
|
销量 |
均价 |
中间价 |
销量 |
均价 |
中间价 |
销量 |
均价 |
中间价 |
|
独立屋 |
138 |
$530,517 |
$489,000 |
145 |
$601,373 |
$515,250 |
174 |
$581,519 |
$525,000 |
2012年12月
摘要:维多利亚地区独立屋销售145个。销量同比下降14.70%,环比下降21.20%。六个月平均价格$598,153。
|
|
2012年12月 - December |
2012年11月 - November |
2011年12月 - December |
||||||
|
|
销量 |
均价 |
中间价 |
销量 |
均价 |
中间价 |
销量 |
均价 |
中间价 |
|
独立屋 |
145 |
$601,373 |
$515,250 |
184 |
$643,832 |
$545,000 |
170 |
$592,582 |
$535,750 |
2012年11月
摘要:维多利亚地区独立屋销售184个。销量同比下降32.10%,环比下降3.16%。六个月平均价格$596,197。
|
|
2012年11月 - November |
2012年10月 - October |
2011年11月 - November |
||||||
|
|
销量 |
均价 |
中间价 |
销量 |
均价 |
中间价 |
销量 |
均价 |
中间价 |
|
独立屋 |
184 |
$643,832 |
$545,000 |
190 |
$592,097 |
$526,500 |
271 |
$592,034 |
$530,000 |
2012年10月
摘要:维多利亚地区独立屋销售190个。销量同比下降20.17%,环比持平。六个月平均价格$596,671。
|
|
2012年10月 - October |
2012年09月 - September |
2011年10月 - October |
||||||
|
|
销量 |
均价 |
中间价 |
销量 |
均价 |
中间价 |
销量 |
均价 |
中间价 |
|
独立屋 |
190 |
$592,097 |
$526,500 |
190 |
$589,361 |
$518,500 |
238 |
$595,836 |
$539,750 |
 Emailor call:
- Cell: 250-744-8215
- Office: 250-479-3333
- Fax: 250-479-3565